Report with Cross-Primitives
Cross-primitives include: Vertical Line, Rectangle and Rounded Rectangle. The start and end points of cross-primitives can be placed on different components of a report. To design a report with cross-primitives, follow the steps below:
1. Run the designer;
2. Connect the data:
2.1. Create a New Connection;
2.2. Create a New Data Source;
3. Create a report or load previously saved one. For our example we take a Simple List Report report, described in Simple List Report article.
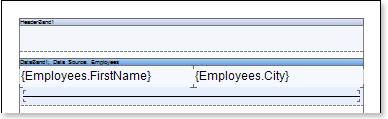
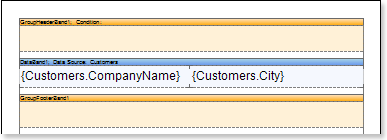
4. Add GroupHeaderBand and GroupFooterBand to a report template. The GroupHeaderBand should be placed above the DataBand to which it applies. The GroupFooterBand should be placed below the DataBand. And it is meant exactly the DataBand, that is associated with the GroupHeaderBand. Each GroupFooterBand, refers to a certain GroupHeaderBand. The GroupFooterBand will not be output without the GroupHeaderBand.
5. Edit the GroupHeaderBand and the GroupFooterBand:
5.1. Align them by height;
5.2. Change the values of the required properties. For example, set the KeepGroupHeaderTogether property for the GroupHeaderBand to true, if you want the GroupHeaderBand be kept with the group. And set the KeepGroupFooterTogether property for the GroupFooterBand to true, if you want this band be kept with the group;
5.3. Set the background color for the GroupHeaderBand;
5.4. If necessary, set the Borders for the DataBand;
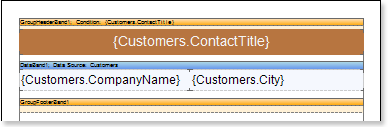
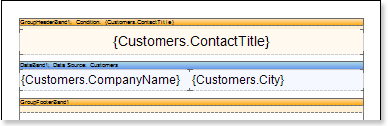
6. Set the condition of data grouping in the report using the Condition property of the GroupHeaderBand. Condition for the grouping can be set by specifying an expression or by selecting a column from a data source. In this example, we specify the {Customers.ContactTitle} expression of the grouping condition, so, when rendering the report, a list of companies will be grouped by the ContactTitle column data.
7. Put a text component in the GroupHeaderBand with the following expression: {Customers.ContactTitle}. So when rendering the report, as a group header, the entries from the ContactTitle data column will be output. Put a text component in the GroupFooterBand with the following expression: {Count ()}. The {Count ()} function will count the number of entries in each group.
8. Edit expressions, and text components:
8.1. Drag and drop text components in the GroupHeaderBand and GroupFooterBand;
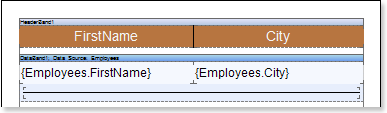
8.2. Set the font settings: size, style, color;
8.3. Align text components by height and width;
8.4. Set background color of text components;
8.5. Set the expression in the text components;
8.6. Set the value of the required properties;
8.7. Set Borders of text components, if required;
8.8. Set the border color.
9. Click the Preview button or invoke the Viewer, clicking the Preview menu item. After rendering a report all references to data fields will be changed on data from specified fields.
10. Go back to the report template;
11. Add the Rectangle cross-primitive to the report template. Starting points of the rectangle will lie in the GroupHeaderBand, and the end point will lie in the GroupFooterBand.
12. Click the Preview button or invoke the Viewer, clicking the Preview menu item. After rendering a report all references to data fields will be changed on data from specified fields. The picture below shows a rendered report page with grouping and the rendered Rectangle cross-primitive:
Adding Styles
| 1. | Go back to the report template; |
| 2. | Select DataBand; |
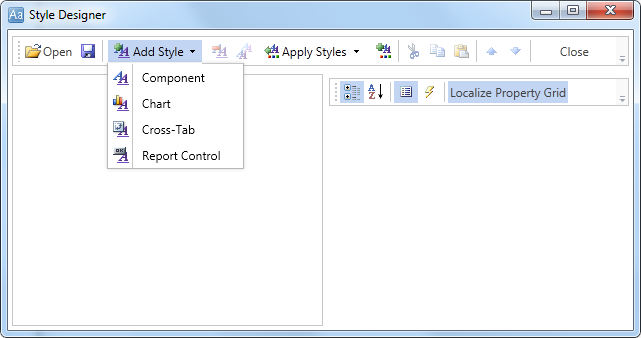
| 3. | Change values of Even style and Odd style properties. If values of these properties are not set, then select the Edit Styles in the list of values of these properties and, using Style Designer, create a new style. The picture below shows the Style Designer: |
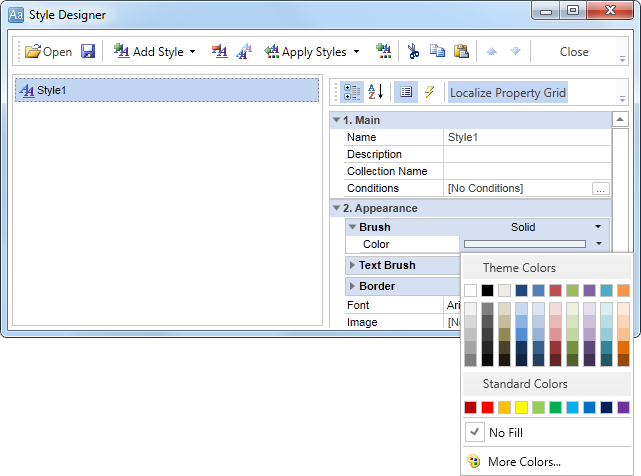
Click the Add Style button to start creating a style. Select Component from the drop down list. Set the Brush.Color property to change the background color of a row. The picture below shows a sample of the Style Designer with the list of values of the Brush.Color property:
Click Close. Then a new value in the list of Even style and Odd style properties (a style of a list of odd and even rows) will appear.
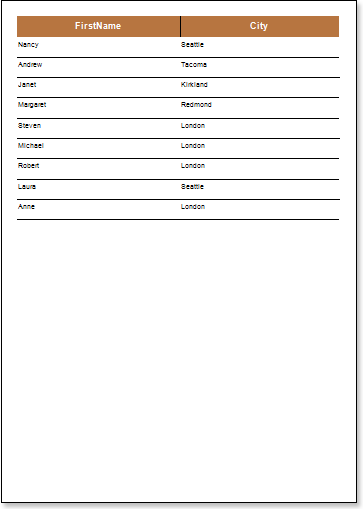
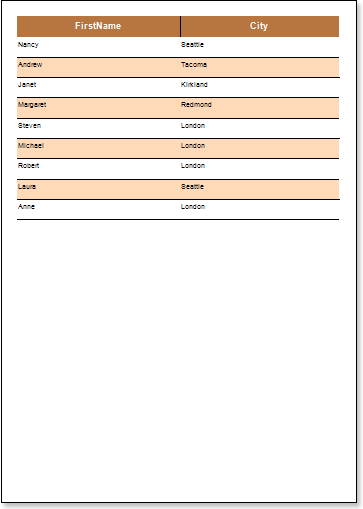
4. To render the report, click the Preview button or invoke the Viewer, clicking the Preview menu item.