Report with Columns in Data Band
Do the following steps to create a report with columns in DataBand:
| 1. | Run the designer; |
| 2. | Connect data: |
2.1. Create New Connection;
2.2. Create New Data Source;
| 3. | Put a DataBand on a page of a report template. |
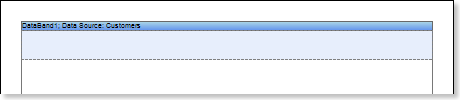
| 4. | Define the data source for the DataBand using, for example, the Data Source property: |
![]()
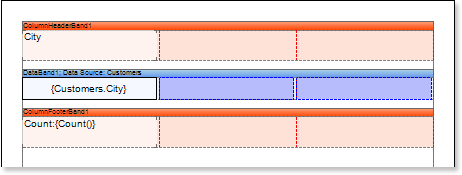
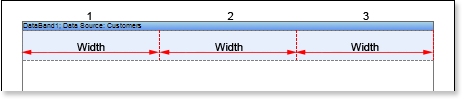
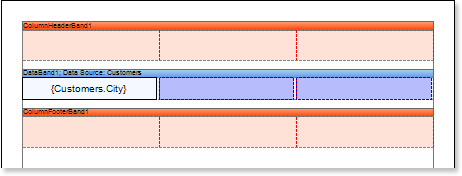
| 5. | Set column options: the number of columns, column width, and column gap. For example, set the number of columns equal to 3, with the gap equal to 0. The column width is created automatically. The picture below shows a sample of the report template with two columns, placed in the DataBand: |
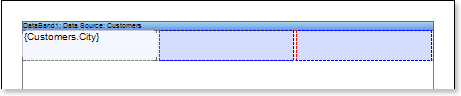
| 6. | Put a text component with expressions on the DataBand. Where expression is a reference to the data field. For example, put one text component with the {Customers.City} expression. |
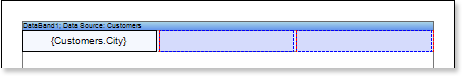
| 7. | Edit expressions and text components: |
7.1. Drag and drop the text component in DataBand;
7.2. Change parameters of the text font: size, type, color;
7.3. Align the text component by width and height;
7.4. Change the background of the text component;
7.5. Align text in the text component;
7.6. Change the value of properties of the text component. For example, set the Word Wrap property to true, if you need a text to be wrapped;
7.7. Enable Borders for the text component, if required.
7.8. Change the border color.
| 8. | Set the columns direction of data output using the Column Direction property. Read about this property in section Report Internals -> Columns. |
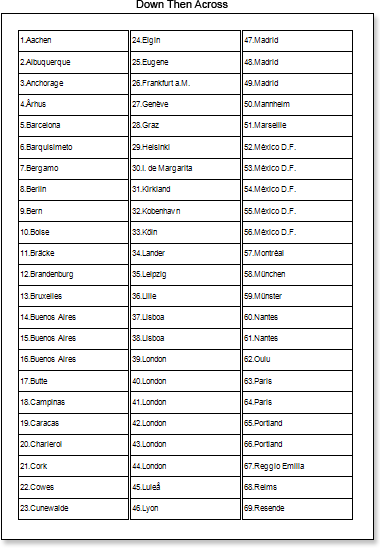
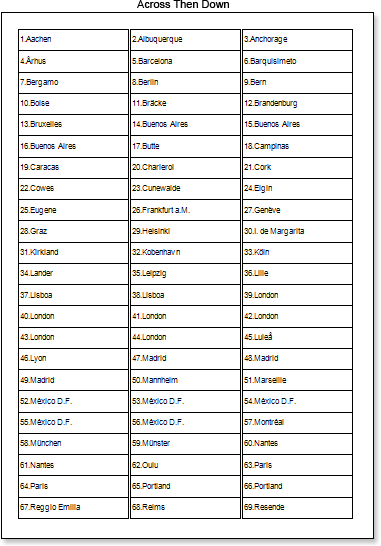
| 9. | Click the Preview button or invoke the Viewer, clicking the Preview menu item. After rendering all references to data fields will be changed on data form specified fields. Data will be output in consecutive order from the database that was defined for this report. The amount of copies of the DataBand in the rendered report will be the same as the amount of data rows in the database. The picture below shows samples of reports with columns rendered using different values of the Column Direction property. |
| 10. | Go back to the report template; |
11. If needed, add other bands to the report template, for example, ColumnHeaderBand and ColumnFooterBand.

12. Edit these bands:
12.1. Align them by height;
12.2. Change values of properties, if required;
12.3. Change the background of bands;
12.4. Enable Borders, if required;
12.5. Set the border color.
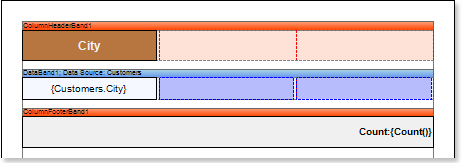
13. Put text components with expressions in the these bands. Where expression of the text component in the ColumnHeaderBand is the column name and the expression of the text component in the ColumnFooterBand is the data footer.
14. Edit Text and TextBox component:
14.1. Drag and drop the text component in ColumnHeaderBand and ColumnFooterBand;
14.2. Change parameters of the text font: size, type, color;
14.3. Align the text component by width and height;
14.4. Change the background of the text component;
14.5. Align text in the text component;
14.6. Change the value of properties of the text component. For example, set the Word Wrap property to true, if you need a text to be wrapped;
14.7. Enable Borders for the text component, if required.
14.8. Change the border color.
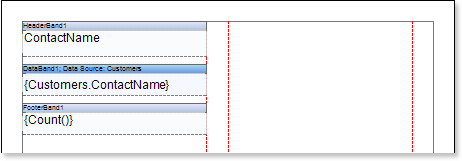
15. Click the Preview button or invoke the Viewer, clicking the Preview menu item. After rendering all references to data fields will be changed on data form specified fields. Data will be output in consecutive order from the database that was defined for this report. The amount of copies of the DataBand in the rendered report will be the same as the amount of data rows in the database. The picture below shows samples of reports with column headers.
Adding styles
| 1. | Go back to the report template; |
| 2. | Select DataBand; |
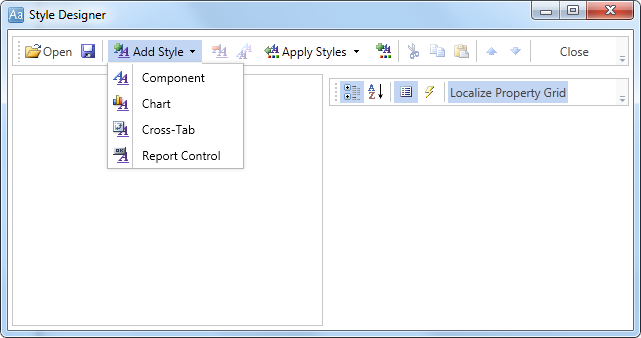
| 3. | Change values of Even style and Odd style properties. If values of these properties are not set, then select the Edit Styles in the list of values of these properties and, using Style Designer, create a new style. The picture below shows the Style Designer: |
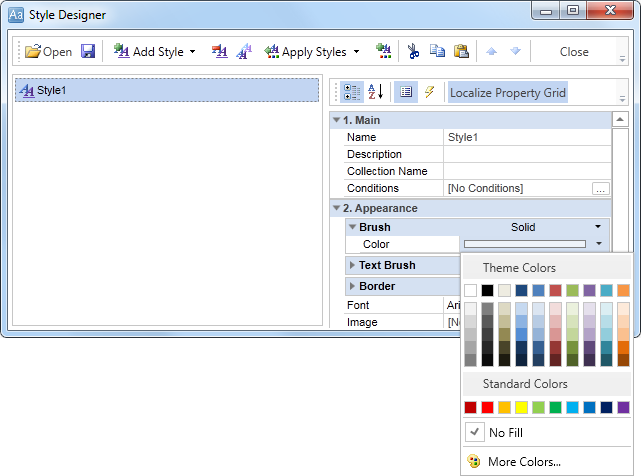
Click the Add Style button to start creating a style. Select Component from the drop down list. Set the Brush.Color property to change the background color of a row. The picture below shows a sample of the Style Designer with the list of values of the Brush.Color property:
Click Close. Then in the list of Even style and Odd style properties a new value (a style of a list of odd and even rows).
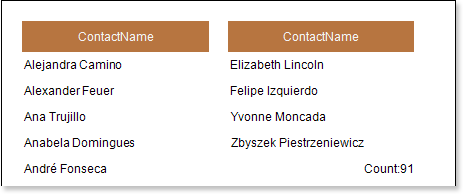
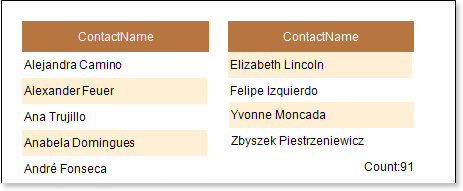
4. To render the report, click the Preview button or invoke the Viewer, clicking the Preview menu item. The picture below shows a sample of a rendered report with columns on a page and alternative color of rows: