Master-Detail Report and Sub-Reports
Do the following steps to create a Master-Detail report with sub-reports:
| 1. | Run the designer; |
| 2. | Connect data: |
2.1. Create New Connection;
2.2. Create New Data Source;
3. Create Relation between data sources. If the relation will not be created and/or the Relation property of the Detail data source will not be filled, then, for Master entry, all Detail entries will be output;
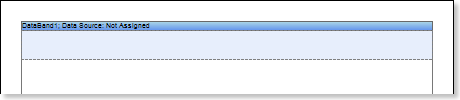
4. Put the DataBand1 on a page of a report template:
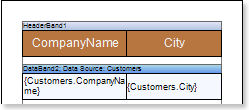
5. Edit DataBand1:
5.1. Align the DataBand1 by height;
5.2. Change values of band properties. For example, set the Can Break property to true, if you wish the data band to be broken;
5.3. Change the DataBand1 background color;
5.4. Enable Borders for the DataBand1, if required;
5.5. Change the border color.
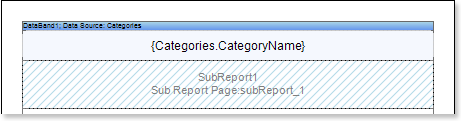
6. Define the data source for the DataBand1 using the Data Source property. For example, define the Categories data source for the DataBand2:
![]()
7. Put text components with expressions in the DataBand1. Where an expression is a reference to a data field. For example, put the text component with the following expression in the DataBand1 (Master component): {Categories.CategoryName};
8. Edit Text and TextBoxes:
8.1. Drag the text component to the required place in the DataBand1;
8.2. Set the text font: size, style, color;
8.3. Align text component vertically and horizontally;
8.4. Set the background color of the text component;
8.5. Align text in the component;
8.6. Set values of the properties of text components. For example to set the Word Wrap property to true, if you want the text to be wrapped;
8.7. Set Borders of a text component.
8.8. Set the border color.
9. Put a Sub-Report component in the DataBand1;
10. Edit the Sub-Report components:
10.1. Stretch the Sub-Report components as seen on the picture below;
10.2. Change the value of properties of Sub-Reports. For example, set the Keep Sub-Report Together property to true, if you want the sub-report to be kept together;;
10.3. Change the background color of the components.
11. Go to the sub-report page;
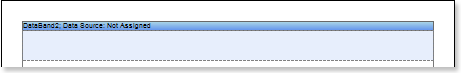
12. Add to the DataBand2 to the sub-report page.
13. Edit DataBand2:
13.1. Align the DataBand2 by height;
13.2. Change values of band properties. For example, set the Can Break property to true, if you wish the data band to be broken;
13.3. Change the DataBand2 background color;
13.4. Enable Borders for the DataBand2, if required;
13.5. Change the border color.
14. Define the data source for the DataBand1 using the Data Source property. For example, define the Products data source for the DataBand2:
![]()
15. Define the Master component in a report. In our case set the DataBand1 as a Master component for the DataBand2;
16. Fill the Data Relation property of the DataBand, that is the Detail component, in this case for the DataBand2;
17. Put text components with expressions in the DataBand1. Where an expression is a reference to a data field. For example, put the text component with the following expression in the DataBand2: {Products.ProductName} and {Products.UnitPrice};
18. Edit Text and TextBoxes:
18.1. Drag the text component to the required place in the DataBand2;
18.2. Set the text font: size, style, color;
18.3. Align text component vertically and horizontally;
18.4. Set the background color of the text component;
18.5. Align text in the component;
18.6. Set values of the properties of text components. For example to set the Word Wrap property to true, if you want the text to be wrapped;
18.7. Set Borders of a text component.
18.8. Set the border color.
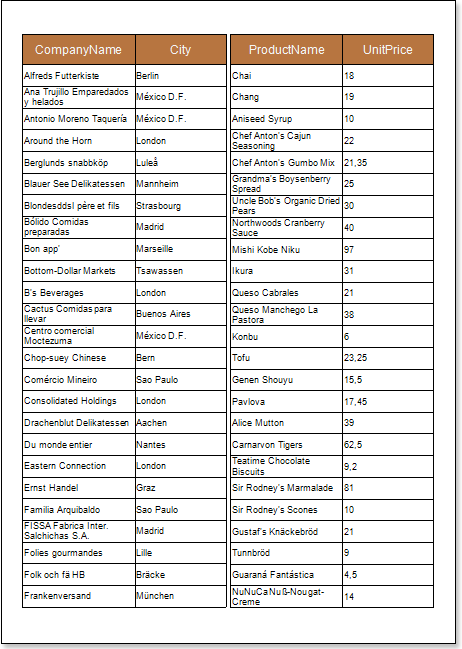
19. Click the Preview button or call Viewer, using the Preview menu item to see how the report will look like:

20. Go back to the report template;
21. If necessary, add some bands to the report template, for example, the HeaderBand;
22. Edit this band:
22.1. Align vertically this band;
22.2. Set values of the properties of the HeaderBand, if necessary;
22.3. Set the background color;
22.4. Set Borders of a text component.
22.5. Set the border color.

23. Put a text component with expression where the expression of the text component in the HeaderBand will be the page title.
24. Edit the text component:
24.1. Drag the text component to the required place in the band;
24.2. Set the text font: size, style, color;
24.3. Align text component vertically and horizontally;
24.4. Set the background color of the text component;
24.5. Align text in the component;
24.6. Set values of the properties of text components;
24.7. Set Borders of a text component.
24.8. Set the border color.
25. Click the Preview button or call Viewer, using an F5 hot key or the Preview menu item to see how the report will look like:

Adding styles
| 1. | Go back to the report template; |
| 2. | Select the sub-report; |
| 3. | Select the DataBand; |
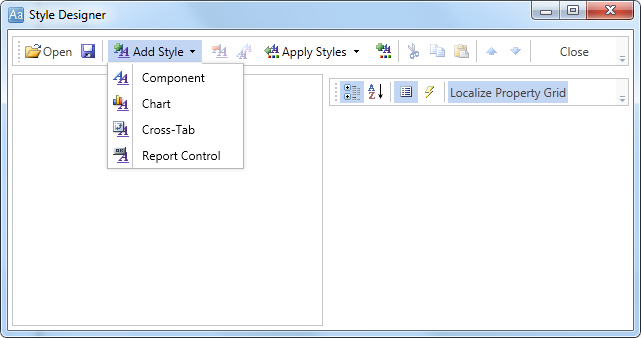
| 4. | Change values of Even style and Odd style properties. If values of these properties are not set, then select the Edit Styles in the list of values of these properties and, using Style Designer, create a new style. The picture below shows the Style Designer. |
Click the Add Style button to start creating a style. Select Component from the drop down list. Set the Brush.Color property to change the background color of a row. The picture below shows a sample of the Style Designer with the list of values of the Brush.Color property:
Click Close. Then a new value in the list of Even style and Odd style properties (a style of a list of odd and even rows) will appear.
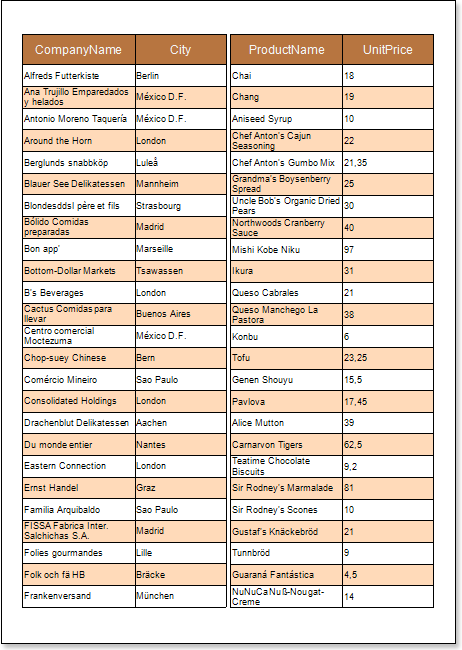
5. To render the report, click the Preview button or invoke the Viewer, clicking the Preview menu item. The picture below shows a sample of a rendered "master-detail report with sub-report" with alternative color of rows:
