Hierarchical Report
Do the following steps to create a hierarchical report:
| 1. | Run the designer; |
| 2. | Connect data: |
2.1. Create New Connection;
2.2. Create New Data Source;
3. Put the HierarchicalBand on a page of the report template.
4. Edit the HierarchicalBand:
4.1. Align the HierarchicalBand by height;
4.2. Set the properties of the HierarchicalBand. For example, set the Can Break property to true, if it is necessary for the HierarchicalBand to be broken;
4.3. Set the background of the HierarchicalBand;
4.4. Set the Borders of the HierarchicalBand;
4.5. Set the border color.
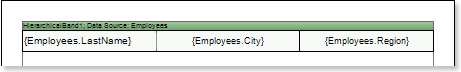
5. Set the data source of the HierarchicalBand using the Data Source property:
![]()
6. Put text components with expressions in the HierarchicalBand. Where the expression is a reference to the data field. For example, put three text component with expressions: {Employees.LastName}, {Employees.City}, and {Employees.Region};
7. Edit text (Text) and text components (TextBox):
7.1. Drag the text component to the required place in the HierarchicalBand;
7.2. Set the font of the text: the size, style, color;
7.3. Align the text component vertically and horizontally;
7.4. Set the background color of the text component;
7.5. Align text in the text component;
7.6. Set values of the properties of a text component. For example, set the Word Wrap property to true, if you want the text to be wrapped;
7.7. Set Borders of a text component.
7.8. Set the border color.
8. Set the KeyDataColum property, select a data column on which an identification number of the data row will be assigned. In this case, select the EmployeeID data column:
![]()
9. Set the MasterKeyDataColum property, select a data column on which the reference to the table's primary key of the parent entry will be specified. In this case, select the ReportsTo data column:
![]()
10. Set the Indent property, set an offset of the detail entry in relation to the parent one. In this example, the Indent property will be 20 units in the report (centimeters, inches, hundredths of inches, pixels);
![]()
11. Set the ParentValue property, indicate the entry, which will be a parent for all rows. If this property is not specified, the default value is used. By default, the Parent Value property is set to null. In this case, the value of the ParentValue property is not specified, so the default value is used:
![]()
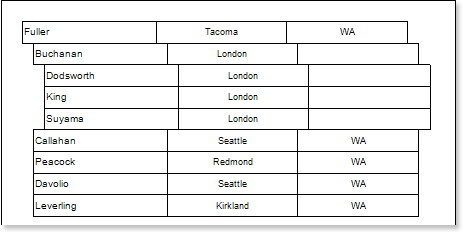
12. Click the Preview button or call Viewer, using the Preview menu item. After rendering a report, all references to data sources will be replaced with data from these sources. Data will be taken sequentially from the data source, which has been specified for this band. Number of copies of the DataBand in the report is equal to the number of rows in the data source.

13. Go back to the report template;
14. If necessary, add other bands into the report template, for example, HeaderBand;
15. Edit this band:
15.1. Align the HeaderBand vertically;
15.2. Set properties of the HeaderBand, if necessary;
15.3. Set the background color of the HeaderBand;
15.4. If necessary, set the Borders;
15.5. Change the border color.
16. Put text components with the expressions. Where expressions in text components in the HeaderBand will be the data headers;
17. Edit text and text components:
17.1. Drag the text component to the required place in the band;
17.2. Set the font settings: size, style, color;
17.3. Align the text component vertically and horizontally;
17.4. Set the background color of the text component;
17.5. Align the text in a text component;
17.6. Set the value of properties of a text component, if necessary;
17.7. If necessary, set Borders of a text component;
17.8. Set the border color.

18. Click the Preview button or call Viewer, using the Preview menu item. After rendering a report, all references to data sources will be replaced with data from these sources:

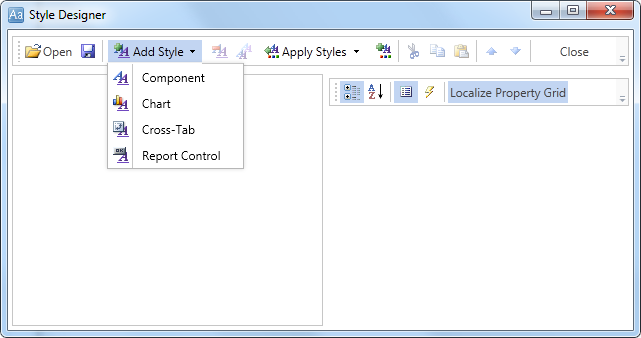
Adding styles
| 1. | Go back to the report template; |
| 1. | Select component. In our case this is the text component; |
| 2. | Invoke the Conditions dialog box. For example, click the Conditions button on the control panel. |

| 3. | To get started, you must click the Add Condition button and in the Conditions dialog box the condition and formatting options will be displayed. The condition can be of two types: Value and Expression. In this case, consider an example of a condition, such as Expression. The picture below shows an example of Conditions dialog box with options and conditions of formatting: |

| 4. | Specify the options of conditional formatting. In this case, to specify the condition means to specify the expression. For example, Line% 2 == 1, and set the formatting means to change the background, for example, by pressing the Back Color button and selecting the drop-down list of values of the background color. |
| 5. | Click OK. It should also be noted that to odd and even rows have different styles, it is necessary to make a conditional formatting of each text component; |
| 6. | Render a report by clicking on the Preview tab or call the Viewer clicking the Preview menu item. |