Drill-Down Report Using External Report
Drill-Down report using external report is an interactive report in what detailed data are placed in an external report and the relationship between master and detailed data in reports is organized using the Interaction.Drill-Down Report property. Follow the steps below to design the report:
Creating a report with detailed data
| 1. | Run the designer; |
2. Connect the data:
2.1. Create a New Connection;
2.2. Create a New Data Source;
3. Put the DataBand on a report page:
4. Edit the DataBand:
4.1. Align the DataBand;
4.2. Change the values of properties;
4.3. Set the background color of the DataBand;
4.4. Set Borders, if required;
4.5. Set the border color.
5. Specify the data source in DataBand using the Data Source property:
![]()
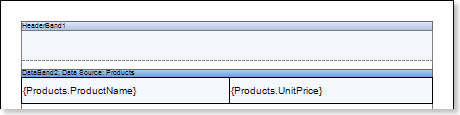
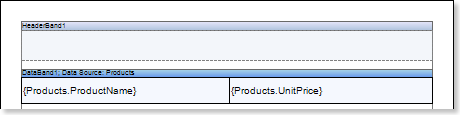
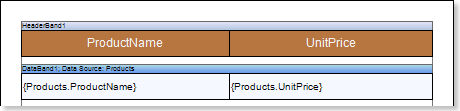
6. Put text components with expressions in the DataBand. Where the expression is a reference to the data field. For example: put two text components with the {Products.ProductName} and {Products.UnitePrice} expressions in the DataBand;
7. Edit text and text components located in the DataBand:
7.1. Drag the text component to the required place in the DataBand;
7.2. Align the text in a text component;
7.3. Change the value of the required properties. For example to set the Word Wrap property to true, if you want the text be wrapped;
7.4. Set Borders of a text component, if required;
7.5. Change the border color.
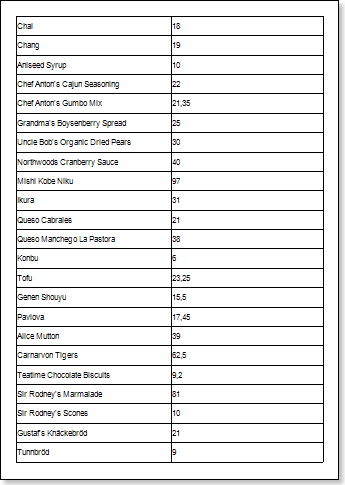
8. Click the Preview button or invoke the Viewer, clicking the Preview menu item. After rendering all references to data fields will be changed on data form specified fields. Data will be output in consecutive order from the database that was defined for this report. The amount of copies of the DataBand in the rendered report will be the same as the amount of data rows in the database. The picture below shows a sample of a report:
9. Go back to the report template;
10. Add other bands to a report template, for example, add the HeaderBand to the report page;
11. Edit the band:
11.1. Align it by height;
11.2. Change values of properties, if required;
11.3. Change the background of the band;
11.4. Enable Borders, if required;
11.5. Set the border color.
12. Put a text component with an expression in this band. The expression in the text component is a header in the HeaderBand.
13. Edit text and text components:
13.1. Drag and drop the text component in the band;
13.2. Change font options: size, type, color;
13.3. Align text component by height and width;
13.4. Change the background of the text component;
13.5. Align text in the text component;
13.6. Change values of text component properties, if required;
13.7. Enable Borders of the text component, if required;
13.8. Set the border color.
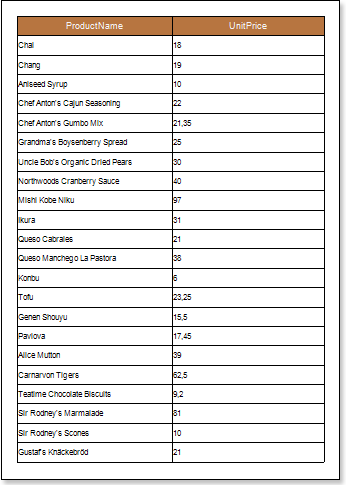
14. Click the Preview button or invoke the Viewer, clicking the Preview menu item. After rendering all references to data fields will be changed on data form specified fields. Data will be output in consecutive order from the database that was defined for this report. The amount of copies of the DataBand in the rendered report will be the same as the amount of data rows in the database. The picture below shows a sample of a report:

15. Go back to the report template;;
16. Set filtering in the DataBand. For example, set the following expression: CategoryID == Products.CategoryID;
17. Save the report. For example, save the report with detailed data on a local disk in the root directory D:\\, with the Drill-Down Report name, full path to the file will be D:\\ Drill-Down Report.mrt.
Creating a report with master data
1. Run the designer;
2. Connect the data:
2.1. Create a New Connection;
2.2. Create a New Data Source;
3. Put the DataBand on a report page:

4. Edit the DataBand:
4.1. Align the DataBand;
4.2. Change the values of properties;
4.3. Set the background color of the DataBand;
4.4. Set Borders, if required;
4.5. Set the border color.
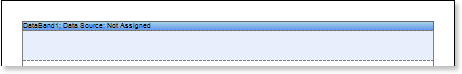
5. Specify the data source in DataBand using the Data Source property:
![]()
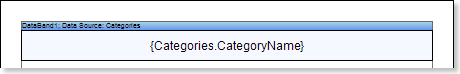
6. Put a text component with expressions in the DataBand. Where the expression is a reference to the data field. For example: put the text component with the {Categories.CategoryName} expression in the DataBand;
7. Edit text and text components located in the DataBand:
7.1. Drag the text component to the required place in the DataBand;
7.2. Align the text in a text component;
7.3. Change the value of the required properties. For example to set the Word Wrap property to true, if you want the text be wrapped;
7.4. Set Borders of a text component, if required;
7.5. Change the border color.
8. Click the Preview button or invoke the Viewer, clicking the Preview menu item. After rendering all references to data fields will be changed on data form specified fields. Data will be output in consecutive order from the database that was defined for this report. The amount of copies of the DataBand in the rendered report will be the same as the amount of data rows in the database. The picture below shows a sample of a report:
Creating an interactive report
1. Go back to the report template with the master data;
2. Select a text component in the DataBand;
3. Set the Interaction.Drill-Down Enabled property to true;
4. Set the Interaction.Drill-Down Report property. Where the value of this property is the full path to the report with detailed data. In our tutorial, the Interaction.Drill-Down Report property will be set to D:\\Drill-Down Report.mrt;
5. Edit Drill-Down Parameter 1:
5.1. The Name property should be set to CategoryID;
5.2. The Expression property should be set to Categories.CategoryID;
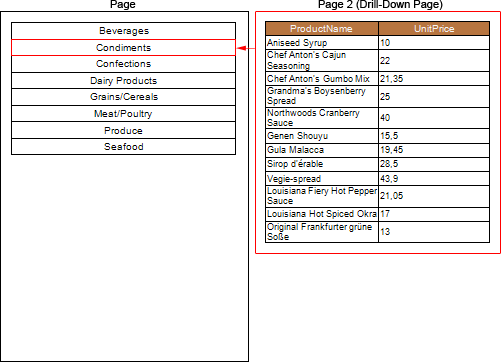
6. Click the Preview button or invoke the Viewer, clicking the Preview menu item. After rendering all references to data fields will be changed on data form specified fields. Data will be output in consecutive order from the database that was defined for this report. The amount of copies of the DataBand in the rendered report will be the same as the amount of data rows in the database. The picture below shows a sample of a report:
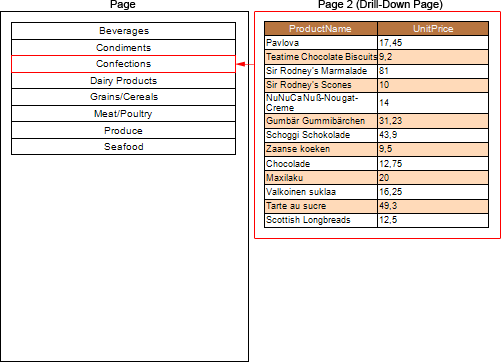
When you click the Beverages, the user will see the detailed data that correspond to filtering conditions and parameters of detailing. The picture below shows a page of a rendered report with detailed data of the Beverages entry:
Adding styles
| 1. | Go back to the report template; |
| 2. | Select the DataBand; |
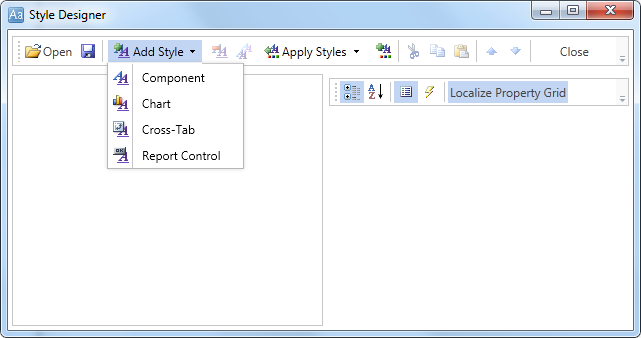
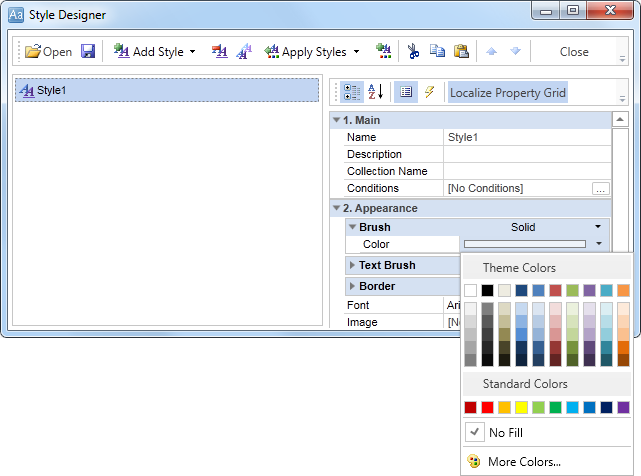
| 3. | Change values of Even style and Odd style properties. If values of these properties are not set, then select the Edit Styles in the list of values of these properties and, using Style Designer, create a new style. The picture below shows the Style Designer. |
Click the Add Style button to start creating a style. Select Component from the drop down list. Set the Brush.Color property to change the background color of a row. The picture below shows a sample of the Style Designer with the list of values of the Brush.Color property:

Click Close. Then a new value in the list of Even style and Odd style properties (a style of a list of odd and even rows) will appear.
| 1. | Save changes in the detailed report by clicking the Save button; |
| 2. | Open the report with master data in the designer; |
| 3. | Click the Preview button or invoke the Viewer, clicking the Preview menu item. The picture below shows the structure of the report, shows the ratio of the detailed data to the Meat/Poultry master entries with different styles of even/odd rows of the DataBand in the detailing report: |