Anchors in Report
Important |
Scripts can be a security risk, so they are disabled in the Interpretation mode. However, if you are confident in the safety of your scripts, you can use them in the Compilation mode.
|
A report with anchors is a report in what there is a page of contents and links (called anchors) to other pages in the report. Follow the steps below to design a report with the anchors.
Creating a page of contents
1. Run the designer;
2. Connect the data:
2.1. Create a New Connection;
2.2. Create a New Data Source;
3. Create Relation between data sources. If the relation will not be created and/or the Relation property of the Detail data source will not be filled, then, for Master entry, all Detail entries will be output;
4. Change the number of columns on a page. For example, set the Columns property to 2, and the ColumnGaps property to 1;
5. Put two DataBands on a page of the report template

6. Edit DataBand1 and DataBand2:
6.1. Align them by height;
6.2. Change values of required properties. For example, if to set the PrintIfDetailEmpty property of the DataBand1 that is the Master component in the Master-Detail report to true, if it is necessary all Master entries be printed in any case, even if Detail entries not present. And set the CanShrink property of the DataBand2 that is the Detail component in the Master-Detail report to true, if it is necessary to shrink this band;
6.3. Change the background color of the DataBands;
6.4. Enable Borders of the band, if required;
7. Specify the data sources for DataBands, as well as assign the Master component. In this case, the Master component is the upper DataBand1, and hence in the DataSetup window the lower DataBand2 on the Wizard tab in the Master Component should indicate DataBand1 as a Master component. Indicate the data sources for DataBands using the Data Source property:
![]()
![]()
8. Fill the DataRelation property of the DataBand2, which is the Detail component:
![]()
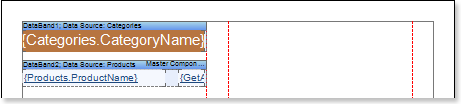
9. Put text components with expressions on DataBands. For example: on the DataBand1, which is the Master component, we put the text component with the following expression: {Categories.CategoryName}, and on the DataBand2, which is the Detail component we put two text components with expressions: {Products.ProductName} and {GetAnchorPageNumber (sender.TagValue)};
10. Edit texts and text components of DataBands:
10.1. Drag and drop a text component in the DataBand;
10.2. Set the font settings: size, style, color;
10.3. Align the text component by height and width;
10.4. Set the background color of the text component;
10.5. Align the text in the component;
10.6. Change the values of the required properties. For example set WordWrap property to true, if you want the text be wrapped;
10.7. If necessary, set Borders for the text component;
10.8. Set the border color.
10.9. Change the value of the Hyperlink property for the text component with the {Products.ProductName} expression. In this case, set the Hyperlink property to the #{Products.ProductName} value;
10.10 Change the value of the Hyperlink and Tag properties for the text component with the {GetAnchorPageNumber(sender.TagValue)}. The Hyperlink property should be set to #{Products.ProductName}, and the Tag property to {Products.ProductName}.
Creating a master list
11. Create a second page in the report template;
12. Put two DataBands on the page of the report template.
13. Edit DataBand3 and DataBand4:
13.1. Align the DataBand by height;
13.2. Change the values of the required properties. For example set the Print if Detail Empty property of the DataBand3, which is the Master component in the Master-Detail report to true, if you want the Master records be printed in any case, even if the Detail entries are not present. Set the CanShrink property of the DataBand4, which is the Detail component in the Master-Detail report to true, if it is necessary for this band be shrunk;
13.3. Set background color of the DataBand;
13.4. If it is necessary, set Borders for the DataBand;
14. Specify the data sources for DataBands, as well as assign the Master component. In this case, the Master component is the upper DataBand3, and hence in the DataSetup window the lower DataBand4 on the Wizard tab in the Master Component should indicate DataBand3 as a Master component. Indicate the data sources for DataBands using the Data Source property:
![]()
![]()
15. Fill the DataRelation property of the DataBand4, which is the Detail component:
![]()
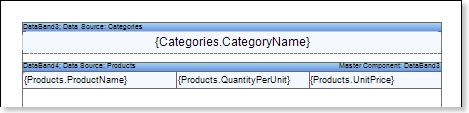
16. Put text components with expressions on DataBands. For example: on the DataBand3, which is the Master component, we put the text component with the following expression: {Categories.CategoryName}, and on the DataBand4, which is the Detail component we put two text components with expressions: {Products.ProductName}, {Products.QuantityPerUnit}, and {Products.UnitPrice};
17. Edit texts and text components of DataBands:
17.1. Drag and drop a text component in the DataBand;
17.2. Set the font settings: size, style, color;
17.3. Align the text component by height and width;
17.4. Set the background color of the text component;
17.5. Align the text in the component;
17.6. Change the values of the required properties. For example set WordWrap property to true, if you want the text be wrapped;
17.7. If necessary, set Borders for the text component;
17.8. Set the border color.

18. Select the DataBand, which is the Master data source. In our case, this is the DataBand3:
18.1. Set the Interaction.Bookmark property of the DataBand3 to {Categories.CategoryName};
19. Select the DataBand, which is the Detail data source. In our case, this is the DataBand4:
19.1. Set the Interaction.Bookmark property to {Products.ProductName};
19.2. Subscribe to the event. Set the RenderingEvent to {AddAnchor (Products.ProductName);};
Report rendering
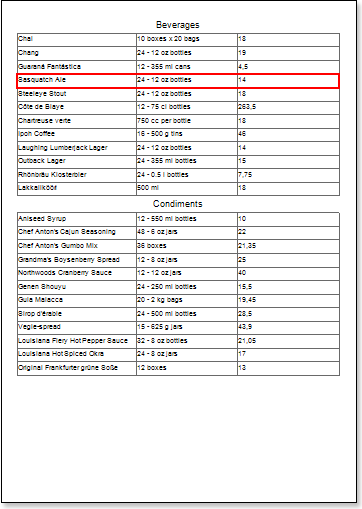
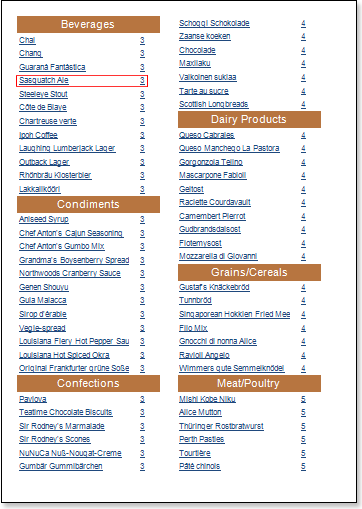
20. Click the Preview button or invoke the Viewer, clicking the Preview menu item. After rendering a report all references to data fields will be changed on data from specified fields.


In the rendered report, when clicking an entry in the table of contents the transition to this entry in the report will be done.
21. Go back to the report template;
22. If needed, add other bands to the report template, for example, HeaderBand;
23. Edit this band:
23.1. Align it by height;
23.2. Change values of properties, if required;
23.3. Change the background of the band;
23.4. Set Borders, if required;
23.5. Set the border color.
24. Put text components with expressions in this band. The expression in the text component is a header in the HeaderBand.
25. Edit text and text components:
25.1. Drag and drop the text component in the band;
25.2. Change font options: size, type, color;
25.3. Align text component by height and width;
25.4. Change the background of the text component;
25.5. Align text in the text component;
25.6. Change values of text component properties, if required;
25.7. Enable Borders of the text component, if required;
25.8. Set the border color.

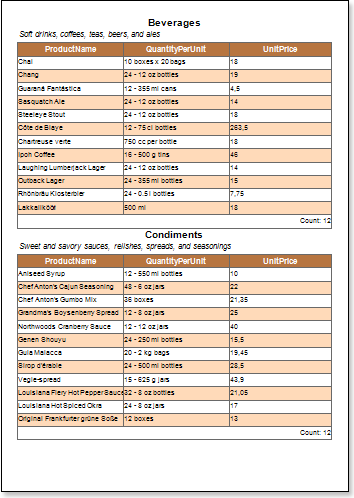
26. Click the Preview button or invoke the Viewer, clicking the Preview menu item. After rendering all references to data fields will be changed on data form specified fields. Data will be output in consecutive order from the database that was defined for this report. The amount of copies of the DataBand in the rendered report will be the same as the amount of data rows in the database.


Adding Styles
| 1. | Go back to the report template; |
2. Select the DataBand. In our case, select the DataBand4;
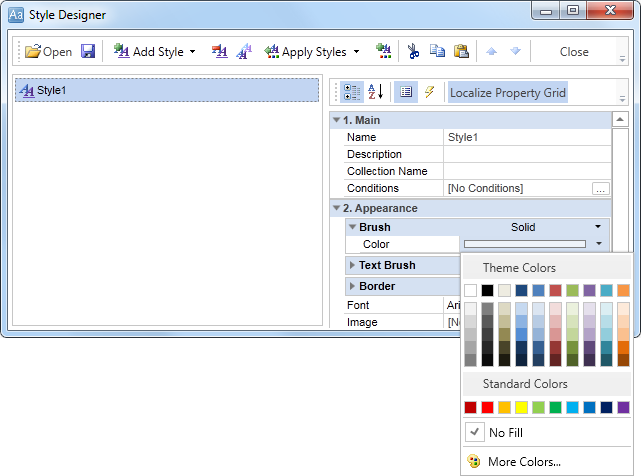
3. Change values of Even style and Odd style properties. If values of these properties are not set, then select the Edit Styles in the list of values of these properties and, using Style Designer, create a new style. The picture below shows the Style Designer:
Click the Add Style button to start creating a style. Select Component from the drop down list. Set the Brush.Color property to change the background color of a row. The picture below shows a sample of the Style Designer with the list of values of the Brush.Color property:
Click Close. Then a new value in the list of Even style and Odd style properties (a style of a list of odd and even rows) will appear.
4. To render the report, click the Preview button or invoke the Viewer, clicking the Preview menu item.