We are glad to announce the availability of Stimulsoft Reports.Wpf version 2010.3. With this release, we have developed sorting of groups by summary, added super tooltips for WPF report designer, Ribbon panel for WPF, two new data adapters, one new barcode, new HTML tags, implemented support of configurations on the properties panel, added new Import.Rtf tool and more. The following is a brief summary of the new features introduced in this product:
Sorting of group by summary
We have added three new properties for the GroupHeaderBand to sort the group by its summary. These are SummarySortDirection - the direction of sorting, SummaryExpression - an expression for calculation of summary, SummaryType - a function type of summary calculation.
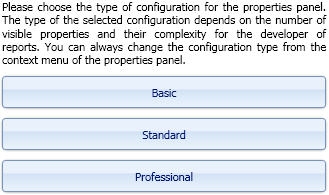
Configurations on the properties panel
When you first run the designer, it is hard for to understand all the properties of the components in the properties panel. To simplify this task, we added the configuration options in the properties panel. There are three configurations: basic, standard, and professional. Depending on the configuration the amount of visible properties of components is changed. In the Basic configuration only simple properties are visible. In the Standard configuration almost all the properties except the most complex or rarely used are displayed. In Professional configuration a complete set of properties is shown. Selecting the type of configuration occurs when you first run the report designer, or from the context menu of the properties panel.
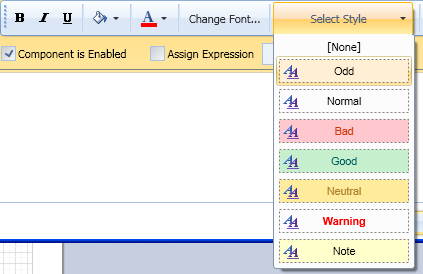
Conditions and styles
One of the interesting improvements in the new version of our product is the ability to use a style of the report in the condition of a component. Selecting of formatting options for the condition could be done before. But now the selected style is stored and used later for the report generation. So it is enough to change the style and the formatting condition options will be changed too.
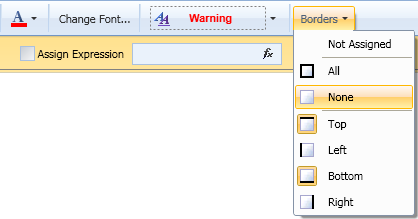
Conditions and borders of components
In addition to improved using of styles in the condition, we have made yet another improvement. Now you can change the borders of components, depending on the conditions. Our customers asked for this option, and now we are pleased to announce that it is available.
New data adapters
The new version provides two new data adapters. The first adapter is designed for dot Connect Universal provider. The adapter is available on the Downloads page of our web-site. The second adapter is designed for accessing MS Access database. The adapter is built into the report engine and can be used without additional configuration.
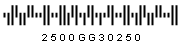
New barcode
We added a new bar code in our report. The full name of the bar code is Royal TPG Post KIX 4-State. This barcode is used for postal purposes in the Netherlands. In the future we will continue implementing new bar codes into our products.
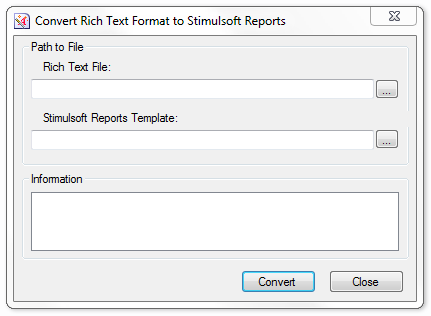
New tool
We added a new tool in our product. This is the Import.Rtf utility. The tool provides the ability to import files in the RTF (Rich Text Format) format to the Stimulsoft Reports format.
Report viewer with Ribbon panel for WPF
A report viewer using Ribbon Panel is available in the new version of the product. If the application uses the Ribbon toolbar, the new control will solve the problem with displaying reports in the same style as the application.
Super tooltips for WPF report designer
The new version of the report designer using the WPF technology now shows the super tooltips for each control. This will simplify the work with the report designer for novice users of our products.
New Html tags
The list of supported tags is widened with two new tags: <strong> </strong> and <p> </p>. Tags work in a text component if the AllowHtmlTags property is enabled. The <strong> </strong> tag works the same as the <b> </b> tag. The <p> </p> tag defines the text paragraph.
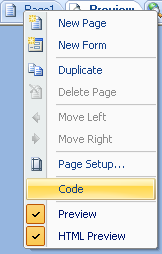
Showing tabs in the report designer
In the new version you can show or hide tabs of viewing report or the code tab in the report designer. Controlling occurs from the context menu of tabs. It is worth noting that since the new version, code tab is hidden by default. Not all of our developers use this tab and for some of them it was not understandable. In any case, the code tab can be displayed at any time using the context menu.
Business Objects and Charts
In previous versions of our product it was not possible to use data from business objects when creating charts. This lack of functionality was corrected in the new version. Data from business objects can be used along with data from data sources.
New Training Resources
We have added a large collection of new videos. These are step-by-step tutorials which show how to create reports in our products. Our documentation was updated with new topics in the HTML section, Getting Started, Exports etc. When using our training resource materials you will receive everything you need for reducing the time and effort you need to design reports.
Sorting of group by summary
We have added three new properties for the GroupHeaderBand to sort the group by its summary. These are SummarySortDirection - the direction of sorting, SummaryExpression - an expression for calculation of summary, SummaryType - a function type of summary calculation.
Configurations on the properties panel
When you first run the designer, it is hard for to understand all the properties of the components in the properties panel. To simplify this task, we added the configuration options in the properties panel. There are three configurations: basic, standard, and professional. Depending on the configuration the amount of visible properties of components is changed. In the Basic configuration only simple properties are visible. In the Standard configuration almost all the properties except the most complex or rarely used are displayed. In Professional configuration a complete set of properties is shown. Selecting the type of configuration occurs when you first run the report designer, or from the context menu of the properties panel.
Conditions and styles
One of the interesting improvements in the new version of our product is the ability to use a style of the report in the condition of a component. Selecting of formatting options for the condition could be done before. But now the selected style is stored and used later for the report generation. So it is enough to change the style and the formatting condition options will be changed too.
Conditions and borders of components
In addition to improved using of styles in the condition, we have made yet another improvement. Now you can change the borders of components, depending on the conditions. Our customers asked for this option, and now we are pleased to announce that it is available.
New data adapters
The new version provides two new data adapters. The first adapter is designed for dot Connect Universal provider. The adapter is available on the Downloads page of our web-site. The second adapter is designed for accessing MS Access database. The adapter is built into the report engine and can be used without additional configuration.
New barcode
We added a new bar code in our report. The full name of the bar code is Royal TPG Post KIX 4-State. This barcode is used for postal purposes in the Netherlands. In the future we will continue implementing new bar codes into our products.
New tool
We added a new tool in our product. This is the Import.Rtf utility. The tool provides the ability to import files in the RTF (Rich Text Format) format to the Stimulsoft Reports format.
Report viewer with Ribbon panel for WPF
A report viewer using Ribbon Panel is available in the new version of the product. If the application uses the Ribbon toolbar, the new control will solve the problem with displaying reports in the same style as the application.
Super tooltips for WPF report designer
The new version of the report designer using the WPF technology now shows the super tooltips for each control. This will simplify the work with the report designer for novice users of our products.
New Html tags
The list of supported tags is widened with two new tags: <strong> </strong> and <p> </p>. Tags work in a text component if the AllowHtmlTags property is enabled. The <strong> </strong> tag works the same as the <b> </b> tag. The <p> </p> tag defines the text paragraph.
Showing tabs in the report designer
In the new version you can show or hide tabs of viewing report or the code tab in the report designer. Controlling occurs from the context menu of tabs. It is worth noting that since the new version, code tab is hidden by default. Not all of our developers use this tab and for some of them it was not understandable. In any case, the code tab can be displayed at any time using the context menu.
Business Objects and Charts
In previous versions of our product it was not possible to use data from business objects when creating charts. This lack of functionality was corrected in the new version. Data from business objects can be used along with data from data sources.
New Training Resources
We have added a large collection of new videos. These are step-by-step tutorials which show how to create reports in our products. Our documentation was updated with new topics in the HTML section, Getting Started, Exports etc. When using our training resource materials you will receive everything you need for reducing the time and effort you need to design reports.