We are glad to announce the official release of the version 2014.2. This release is a next major improvement of reporting tools, which includes a large number of significant new features and enhancements.
New Theme in Flash Designer and Viewer
In Flash Designer and Viewer we have added the theme Office 2013. This new bright theme goes well with the design of modern sites. In the release 2014.2 it is installed by default, but you can optionally select a different design theme.
Support for Text Rotation in Flash Designer
Now you can rotate text to any angle, whether it is a plain text or chart axes titles. Rotation is supported both in the pages of the designer and in the rendered report in the viewer. This makes working with reports easier.
Undo/Redo in Flash Designer
In the new version of all our software which uses the built-in Flash Designer we added the function Undo/Redo. This means that all reporting tools from Stimulsoft have now the function, which allows the user do not worry for his actions.
Undo and Redo save the full list of user actions. The developer can immediately go back by the list and undo the last action (or redo it).
This function can be found on the toolbar in the Ribbon interface.

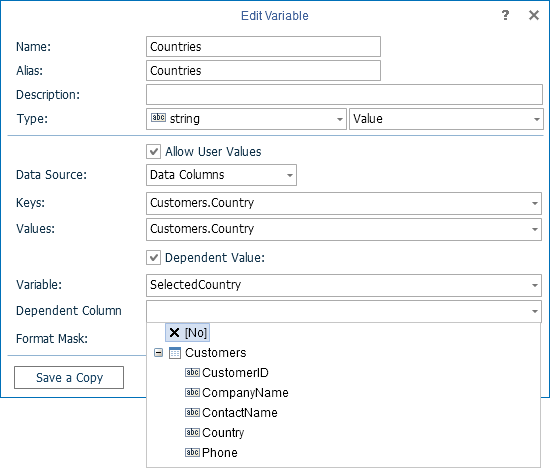
Dependent Variables
In Flash Designer and Viewer we added one function for handling report parameters – dependent variables. In our tools report variables are used as parameters, which may be requested by the user. The report developer indicates in the data dictionary, which variables should be used as report parameters. It also indicates how these parameters are needed to be requested in the report viewer. When the report runs, the parameters are requested in the report viewer and, after their completion, passed to the reports. The reporting tool uses them in the data sample, filtering or for displaying in the report.
In the new version, the report developer can link two variables in the report, making one of them dependent on the other. For example, two variables that display two lists are created in the report. The first one is a list of product categories, and the second one is the list of products. Having created the second variable dependent on the first (linking them), you can filter the list of products in the selected product category. That means that in the second list only the products that fit the selected category in the first variable will be displayed. It should be noted that this level of connection of variables can be not only one in the report, and the number of nested levels is also not limited.
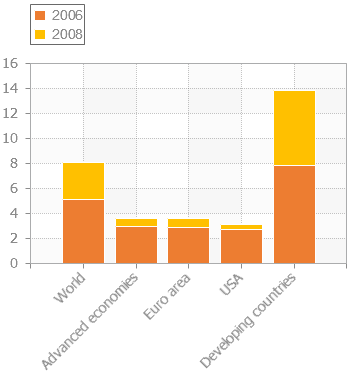
Sort Group by Sum
In the new version of Stimulsoft Reports.Fx 2014.2 it is possible to sort the data groups by the sum.
For example, in a report with a group a list of products which are grouped according to certain categories is output. Products or categories can be sorted in the report by many parameters – name, type, date, etc. Now it is possible to sort the products by the quantity, in other words, by the sum. When grouping, the selected expression or data column is selected. After this, sorting, based on the given values, starts. Additionally, you can enable the sorting option – in ascending or descending order.
Improvements in Exporting to PDF
In previous versions, when you export reports to PDF, it was not possible to rotate the text due to limitations of the Flex platform. In the new version, this problem has been solved – now the text can be rendered on any angle.
Also the important improvement was in improving the quality of barcode images. The fact is that when you export reports to PDF, images have a certain resolution by default, not the base that is set in the settings – 100 dpi. There are some problems of reading the barcode in this resolution. Therefore, especially for barcodes, we have implemented an innovation – now the default resolution of barcodes is three times higher than the resolution of other images and it is 300 dpi. This will allow barcodes to become fully readable when exporting to PDF.
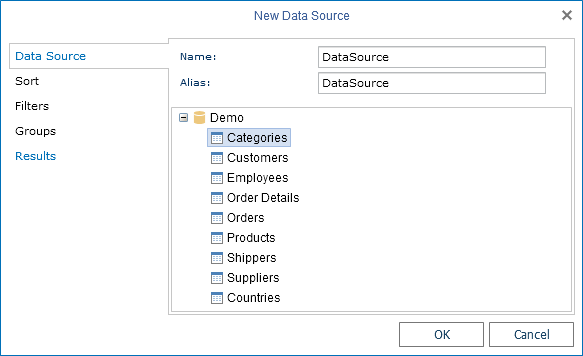
Data From Other Data Sources
In the reporting tool you can create a data source based on existing data sources. The data Source Data from other DataSource provides the same features as a database query. When you create such a data source using the visual interface and the results of calculation using aggregate functions, you can perform sorting, grouping, and filtering in the process of creating a data source.
For example, if you want to create a report that will show the name of the category and the total cost of all the products included in this category, it can be done in various ways. But the easiest way is to create a data source based on other data. Starting with the version 2014.2 Stimulsoft Reports.Fx product line supports using data from other data sources, which greatly simplifies and speeds up work with the reports for our users.
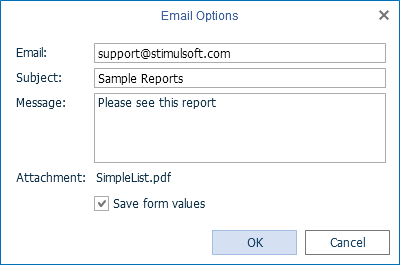
Data Validation Before Sending Them via Email
When you send the report by email using the built-in dialog we have added validation (testing) the correctness of the input data. This will prevent errors when sending reports by email, which makes it easy to use.
Property CacheAllData
The data are presented in tabular form in the Dataset and in order to create a relationship between tables it is necessary that these tables are located in the same Dataset. However, you can create multiple Dataset from several databases and to create a link between the data in our product. In this case, an error will occur due to the fact that it is impossible to create a link between different Datasets. The new version solved this issue by using the property CacheAllData. This property creates a temporary Dataset which will copy all the data in. You should remember that, when working with large amount of data, the consumption of computer memory is increased significantly. This happens because the Flex platform does not have the built-in support for Dataset.
Radical Optimization of Multi-Level Data
Substantial work has been done to optimize the code to work with multi-level data. The fact is that the platform Flex does not have the profiler – a utility that allows you to see how one of the methods works, how often it is called, and how long time it takes to execute this method. So with help of this tool you can identify where in code you can do some optimizations.
However in the version 2014.2 we have optimized all the code, as a result of what, for example, the speed of rendering the master-detail report is increased in 5-6 times, and anchors are functioning the same way as in the .NET version of our product.
New Theme in Flash Designer and Viewer
In Flash Designer and Viewer we have added the theme Office 2013. This new bright theme goes well with the design of modern sites. In the release 2014.2 it is installed by default, but you can optionally select a different design theme.
Support for Text Rotation in Flash Designer
Now you can rotate text to any angle, whether it is a plain text or chart axes titles. Rotation is supported both in the pages of the designer and in the rendered report in the viewer. This makes working with reports easier.
Undo/Redo in Flash Designer
In the new version of all our software which uses the built-in Flash Designer we added the function Undo/Redo. This means that all reporting tools from Stimulsoft have now the function, which allows the user do not worry for his actions.
Undo and Redo save the full list of user actions. The developer can immediately go back by the list and undo the last action (or redo it).
This function can be found on the toolbar in the Ribbon interface.
Dependent Variables
In Flash Designer and Viewer we added one function for handling report parameters – dependent variables. In our tools report variables are used as parameters, which may be requested by the user. The report developer indicates in the data dictionary, which variables should be used as report parameters. It also indicates how these parameters are needed to be requested in the report viewer. When the report runs, the parameters are requested in the report viewer and, after their completion, passed to the reports. The reporting tool uses them in the data sample, filtering or for displaying in the report.
In the new version, the report developer can link two variables in the report, making one of them dependent on the other. For example, two variables that display two lists are created in the report. The first one is a list of product categories, and the second one is the list of products. Having created the second variable dependent on the first (linking them), you can filter the list of products in the selected product category. That means that in the second list only the products that fit the selected category in the first variable will be displayed. It should be noted that this level of connection of variables can be not only one in the report, and the number of nested levels is also not limited.
Sort Group by Sum
In the new version of Stimulsoft Reports.Fx 2014.2 it is possible to sort the data groups by the sum.
For example, in a report with a group a list of products which are grouped according to certain categories is output. Products or categories can be sorted in the report by many parameters – name, type, date, etc. Now it is possible to sort the products by the quantity, in other words, by the sum. When grouping, the selected expression or data column is selected. After this, sorting, based on the given values, starts. Additionally, you can enable the sorting option – in ascending or descending order.
Improvements in Exporting to PDF
In previous versions, when you export reports to PDF, it was not possible to rotate the text due to limitations of the Flex platform. In the new version, this problem has been solved – now the text can be rendered on any angle.
Also the important improvement was in improving the quality of barcode images. The fact is that when you export reports to PDF, images have a certain resolution by default, not the base that is set in the settings – 100 dpi. There are some problems of reading the barcode in this resolution. Therefore, especially for barcodes, we have implemented an innovation – now the default resolution of barcodes is three times higher than the resolution of other images and it is 300 dpi. This will allow barcodes to become fully readable when exporting to PDF.
Data From Other Data Sources
In the reporting tool you can create a data source based on existing data sources. The data Source Data from other DataSource provides the same features as a database query. When you create such a data source using the visual interface and the results of calculation using aggregate functions, you can perform sorting, grouping, and filtering in the process of creating a data source.
For example, if you want to create a report that will show the name of the category and the total cost of all the products included in this category, it can be done in various ways. But the easiest way is to create a data source based on other data. Starting with the version 2014.2 Stimulsoft Reports.Fx product line supports using data from other data sources, which greatly simplifies and speeds up work with the reports for our users.
Data Validation Before Sending Them via Email
When you send the report by email using the built-in dialog we have added validation (testing) the correctness of the input data. This will prevent errors when sending reports by email, which makes it easy to use.
Property CacheAllData
The data are presented in tabular form in the Dataset and in order to create a relationship between tables it is necessary that these tables are located in the same Dataset. However, you can create multiple Dataset from several databases and to create a link between the data in our product. In this case, an error will occur due to the fact that it is impossible to create a link between different Datasets. The new version solved this issue by using the property CacheAllData. This property creates a temporary Dataset which will copy all the data in. You should remember that, when working with large amount of data, the consumption of computer memory is increased significantly. This happens because the Flex platform does not have the built-in support for Dataset.
Radical Optimization of Multi-Level Data
Substantial work has been done to optimize the code to work with multi-level data. The fact is that the platform Flex does not have the profiler – a utility that allows you to see how one of the methods works, how often it is called, and how long time it takes to execute this method. So with help of this tool you can identify where in code you can do some optimizations.
However in the version 2014.2 we have optimized all the code, as a result of what, for example, the speed of rendering the master-detail report is increased in 5-6 times, and anchors are functioning the same way as in the .NET version of our product.