Optimization is a vexed problem today in nearly all areas of human activity. Unfortunately, there is no exception in reporting. How to most effectively make the process of designing, rendering, and processing reports? Today, these questions concern the majority of users of all reporting products.
Optimizing reports is a set of actions aimed at improving the system and process of working efficiency with the reporting software. Stimulsoft Company offers some useful hints, following which, you will not only save time taken to generate the required reports, but, in general, increase productivity of your staff.
As for designing reports, the optimization here lies in two directions: increasing the speed of report rendering and reducing memory usage.
Data
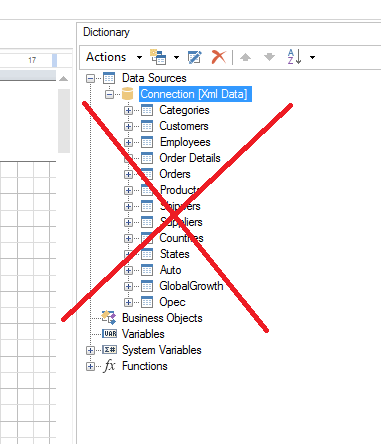
To increase the speed of rendering reports it is necessary to request only needed data from large databases. That is, if for the report you need, for example, only a few tables and fields, then there is no need to add to the dictionary data all the data available in the database. Otherwise, huge amount of resources will be spent on it to get all the data, not to mention the time spent. Also, it would be logical to use a WHERE construction in SQL. In case you do not need all the fields and records from a table, etc., but only the ones corresponding to specific conditions. But these conditions should be subscribed in the SQL filter, but not in the filter of the Data Band. Using the filter, only a small part of records in the table is displayed. Those records are requested. This applies positive effect on performance.
Also, you can set the SQL Query value to the Filter Engine property of the Data Band. This automatically adds the WHERE condition directly to the SQL query.
Images
Another more important thing in optimizing the process of rendering reports is optimization of images. In most cases, high resolution of images used in the report and their very high quality is not required due to the fact that to view the contents of the report, including the images, a computer monitor or a laptop is used. To reduce memory usage, reduce the size of images to the appropriate size. The best option is to get the desired result without using the Stretch image property.

Rich Text
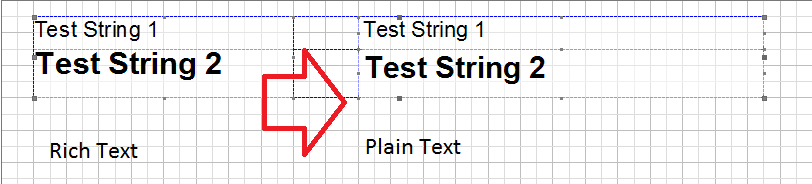
The ability to use several common custom components instead of the RichText component. Since the RichText component is complex some issues with processing may occur. For example in Web, where the RichText editor is not present. So the RichText component is exported to an Excel file as a picture. After that, there are certain difficulties in editing and exporting the whole document.
One Page
When rendering a report, sometimes all the components are not placed on the same page. Typically, users transfer excessive ones on the next report page, group them by one Data Band on one page, or use the Sub-Report component. This is time-consuming.
To increase the speed of rendering reports, we propose to use the Large Height property, which increases your page to a required size.
The property will increase the page in the design mode, and the mode of viewing the report will not “suffer”.
Grouping
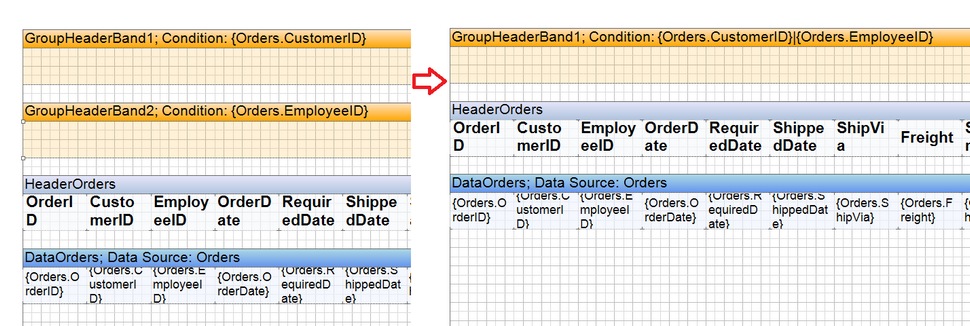
In order to increase the speed of rendering the report you should remove unnecessary groups from the rendered report. For example, grouping by the GroupHeader component. Users group by several categories: ID, Name, Description, and so on, but grouping is enough by the category ID. It is also possible to define complex conditions for grouping, i.e. to create grouping based on multiple fields of conditions. All conditions can be combined into a single group. In this case, instead of 5-6 GroupHeader components, you only need one component. This will speed up the construction of the report and simplify its structure.
Optimizing reports is a set of actions aimed at improving the system and process of working efficiency with the reporting software. Stimulsoft Company offers some useful hints, following which, you will not only save time taken to generate the required reports, but, in general, increase productivity of your staff.
As for designing reports, the optimization here lies in two directions: increasing the speed of report rendering and reducing memory usage.
Data
To increase the speed of rendering reports it is necessary to request only needed data from large databases. That is, if for the report you need, for example, only a few tables and fields, then there is no need to add to the dictionary data all the data available in the database. Otherwise, huge amount of resources will be spent on it to get all the data, not to mention the time spent. Also, it would be logical to use a WHERE construction in SQL. In case you do not need all the fields and records from a table, etc., but only the ones corresponding to specific conditions. But these conditions should be subscribed in the SQL filter, but not in the filter of the Data Band. Using the filter, only a small part of records in the table is displayed. Those records are requested. This applies positive effect on performance.
Also, you can set the SQL Query value to the Filter Engine property of the Data Band. This automatically adds the WHERE condition directly to the SQL query.
Images
Another more important thing in optimizing the process of rendering reports is optimization of images. In most cases, high resolution of images used in the report and their very high quality is not required due to the fact that to view the contents of the report, including the images, a computer monitor or a laptop is used. To reduce memory usage, reduce the size of images to the appropriate size. The best option is to get the desired result without using the Stretch image property.
Rich Text
The ability to use several common custom components instead of the RichText component. Since the RichText component is complex some issues with processing may occur. For example in Web, where the RichText editor is not present. So the RichText component is exported to an Excel file as a picture. After that, there are certain difficulties in editing and exporting the whole document.
One Page
When rendering a report, sometimes all the components are not placed on the same page. Typically, users transfer excessive ones on the next report page, group them by one Data Band on one page, or use the Sub-Report component. This is time-consuming.
To increase the speed of rendering reports, we propose to use the Large Height property, which increases your page to a required size.
The property will increase the page in the design mode, and the mode of viewing the report will not “suffer”.
Grouping
In order to increase the speed of rendering the report you should remove unnecessary groups from the rendered report. For example, grouping by the GroupHeader component. Users group by several categories: ID, Name, Description, and so on, but grouping is enough by the category ID. It is also possible to define complex conditions for grouping, i.e. to create grouping based on multiple fields of conditions. All conditions can be combined into a single group. In this case, instead of 5-6 GroupHeader components, you only need one component. This will speed up the construction of the report and simplify its structure.