Charts
The Chart is a component for visualizing data in a report.
Series |
Description |
Column: |
|
|
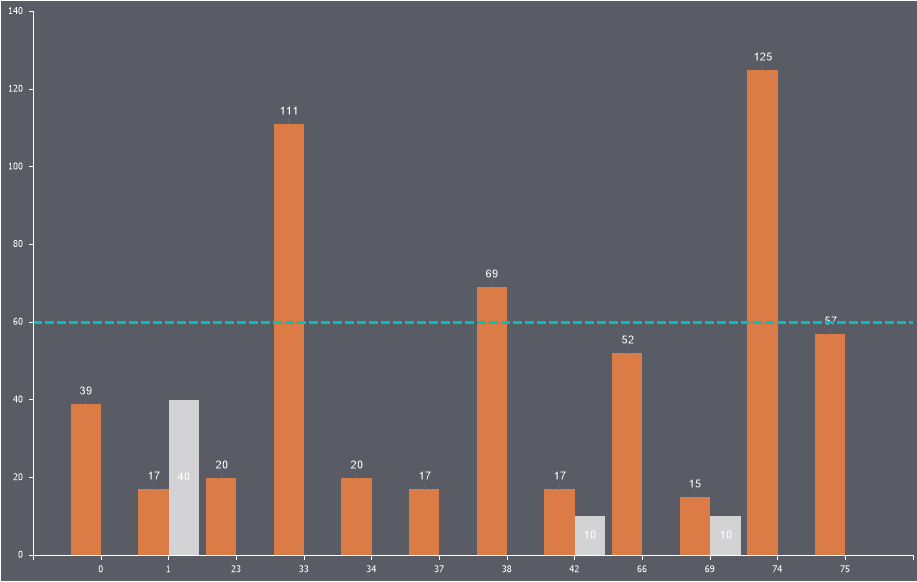
Clustered Column Clustered column charts compare values across categories. |
|
Stacked Column Stacked column charts show the relationship of individual items to the whole, comparing the contribution of each value to a total across categories. |
|
Full-Stacked Column Full-Stacked column allows comparing the percentage of each value. |
|
Pareto |
Line: |
|
|
Line Line and line with markers are used to indicate individual data values, line charts are useful to show trends over time or ordered categories, especially when there are many data points and the order in which they are presented is important. |
|
Stacked Line Displayed with or without markers to indicate individual data values, stacked line charts are useful to show the trend of the contribution of each value over time or ordered categories. If there are many categories or the values are approximate, you should use a stacked line chart without markers. |
|
Full-Stacked Line This is a kind of the Line series by which you can compare the relative proportion of each value of the series among the total aggregate value of specific arguments. Lines without markers are recommended in the approximation of the set of value arguments. |
|
Spline This type of series is used to display a smooth line, the points of which are the values of the series. Each point has its coordinates depending on the value and argument of the chart series. After all points are specified, a spline will be drawn. Points on the chart can be displayed using markers. Spline without markers is recommended in the approximation of the set of value arguments. |
|
Stacked Spline This type of series is used to display a smooth line, the points of which are the values of the series. Each point has its coordinates depending on the value and argument of the chart series. The points of the next row of the chart are located above the smooth line of the previous row of the chart. After all points are specified, a stacked spline will be drawn. Points on the chart can be displayed using markers. Smooth lines without markers are recommended for the approximation of the set of value arguments. |
|
Full-Stacked Spline This is a variety of Spline series, with which you can compare the relative proportion of each value of a series in the total aggregate value of specific arguments. Smooth lines without markers are recommended in the approximation of the set of value arguments. |
|
Stepped Line This is a variation of the Line series, which will be displayed using only vertical and horizontal lines. |
Area: |
|
|
Area Area charts display the trend of values over time or categories. |
|
Stacked Area Stacked area charts display the trend of the contribution of each value over time or categories. |
|
Full-Stacked Area Full-Stacked Area charts display the trend of the percentage each value contributes over time or categories. |
|
Spline Area This is a type of series with smooth lines. In the chart area, points are marked by coordinates - the value and argument of the series. Then, a smooth line passes through these points. The area between the line and the axis of the arguments is filled with color. |
|
Stacked Spline Area A series type that is used to display the ratio of smooth areas across multiple series of a chart. |
|
Full-Stacked Spline Area A series type is used to display the relative proportion of a spline area in the total aggregate value of specific arguments. |
|
Stepped Area This is a type of linear series. In the chart area, points are marked by coordinates - the value and argument of the series. Then, strictly vertical and horizontal lines pass through these points. The area between the line and the axis of the arguments is filled with color. |
Range: |
|
|
Range The chart type Range can be used to display the interval of values per unit of time or period of time. To build such a diagram you should have start and end values. |
|
Spline Range The series of this type displays the interval of change of values by strictly vertical lines and the time interval by any smooth straight lines. |
|
Stepped Range A row of this type displays the interval of changing values by strictly vertical lines and a time interval by strictly horizontal lines. |
|
Range Bar This type of series is used to display a range of values as columns for each argument. Also, if the chart has more than one row, it shows the ratio of the values of different rows for the current argument. |
Clustered Bar: |
|
|
Clustered Bar Clustered bar charts compares values across categories. In a clustered bar chart, the categories are typically organized along the vertical axis, and the values along the horizontal axis. |
|
Stacked Bar Stacked bar charts show the relationship of individual items to the whole. |
|
Full-Stacked Bar This type of charts allows comparing percentage of each value with the total inside the category. |
Scatter: |
|
|
Scatter This type of chart compares pairs of values. Use a scatter chart without lines when you have data in a specific order. |
|
Scatter Line This type of chart can be displayed with or without straight connecting lines between data points. These lines can be displayed with or without markers. |
|
Scatter Spline This type of chart can be displayed with or without a smooth curve connecting the data points. These lines can be displayed with or without markers. Use the scatter chart without markers if there are many data points. |
Pie: |
|
|
Pie Pie charts display the contribution of each value to a total. It is possible to manually pull out the slices of a pie chart to emphasize them. |
Radar: |
|
|
Radar Point |
|
Radar Line |
|
Radar Area This series is used to display three-dimensional data in two-dimensional space, using points and lines that form a region, on a circular region. |
Funnel: |
|
|
Funnel This type of series is used to display statistical data, for example, sales stats and attendance of an online store. Depending on the value, the width of the parts of the graphic element will change. |
|
Funnel Weighted Slices This type of series is used to display statistical data, for example, stats by sales and attendance of an online store. The graphic element will always be in displayed as a funnel, where every part is a separate value. Depending on the value, the height of the parts of the graphic element will change. |
Financial: |
|
|
Candlestick The financial series, using which you can display stock indicators of stocks, currencies, precious metals, etc. |
|
Stock Another series for the financial chart, which displays market trends. |
Other: |
|
|
Treemap |
|
Gantt Gantt charts illustrate the start and finish dates of the terminal elements and summary elements of a project. |
|
Doughnut A doughnut chart is functionally similar to a pie chart, with the exception of a blank center and the ability to support multiple statistics as one. |
|
Bubble |
|
Pictorial |