


Stimulsoft Reports.WEB
Reporting tool for ASP.NET and .NET Core
Stimulsoft Reports.WEB is a cross-platform reporting tool designed to create, build, show, print, and export reports in a web browser. The product includes everything you need to integrate reporting tools into your application built on ASP.NET, ASP.NET MVC, .NET Core, Angular, Blazor, and Python platforms. The product contains a powerful and fast report engine that uses a universal .NET platform, a simple and convenient HTML5 report designer, and an interactive and fast HTML5 viewer.
All-in-one reporting tool
The Reports.WEB report writer is a universal and easy-to-use tool for working with reports on various platforms and operating systems. Our components are developed based on client-server technology, which requires low demands on the PCs of end users. Only HTML5 and JavaScript are used on the client side, so reports work well and quickly on any system and device.On the server side, the rich functionality and versatility of the .NET platform are available. Our components fully support the .NET Framework 4.5.2 and above, .NET 6, .NET 7, .NET 8, .NET9, and .NET 10, which significantly expands the range of available server systems. Thanks to the universal work of algorithms, our solution works perfectly regardless of the platform you use in your projects.
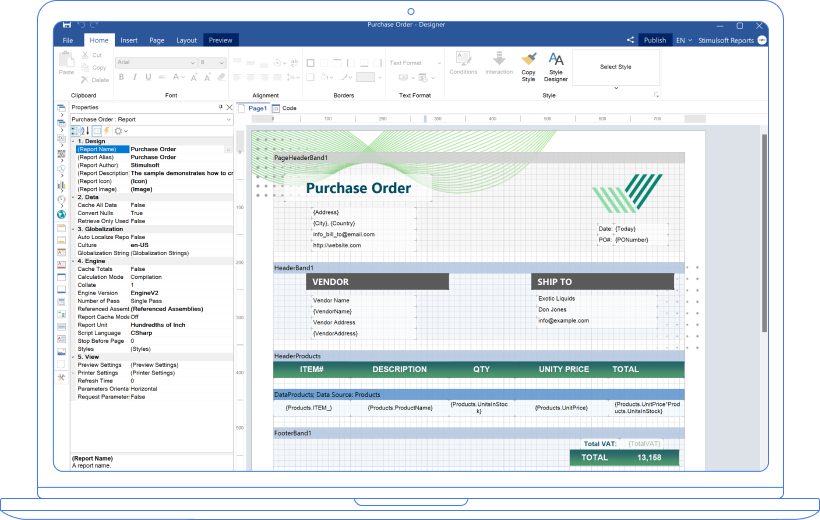
Royalty-Free Report Designer
We offer the Report Designer component that you may integrate and use in your applications and software products. Using it, your clients can design new reports or edit existing ones directly in your application. The integration process is straightforward - just a few lines of code are needed to start working with reports. In addition, the Report Designer component is licensed without the need to pay royalties or license fees for every customer of your applications. Their use and deployment with our embedded tool do not require additional charges.Experience how the component will look when integrated into your application by trying out the online version of our designer.
Report Viewer
The viewer is a special component for viewing reports. As a rule, viewing reports is performed much more often than creating or editing them, so this process is more important. Therefore, the report viewer should be fast, convenient, and fully customizable. Our component supports working with parameters, multi-level drill-down and interactive reports, viewing and saving resources, and much more. For full integration into projects, we offer many themes and options for customizing the appearance and functionality of the application.Integration
Stimulsoft Reports.WEB is designed to integrate into Web projects for ASP.NET, ASP.NET MVC, .NET Core, Angular, Blazor, and Python platforms. You can control all stages of working with a report - from loading and connecting data to viewing and printing a finished report. In addition to the extensive functionality of visual components, any actions on the report can be performed using server-side code. .NET Core
 ASP.NET
 ASP.NET MVC
Data for reports
Our reporting tool supports many ways to connect data to a report using both the report designer functionality and code. We offer a vast list of supported data servers – MS SQL, Firebird, MySQL, PostgreSQL, etc. We support all standard types of OData protocol. You can get data from XML, JSON, Excel, and other files.
Compatibility
The reporting tool for the Web is part of the Stimulsoft platform. Reports created in our other products will work in Reports.WEB and vice versa. You can create a report template in the desktop version of the report designer and continue editing it in the cloud using the online version. We have tried to ensure that reports and dashboards are as compatible as possible for each technology.


Variety of export formats
Work with reports does not end with their design and rendering - they should be shared with employees or sent for review to managers. Our products support export to a large number of formats. These are the popular PDF with support for signatures and encryption, universal HTML for viewing in any browser, text (TXT) for printing on dot matrix printers, and many other file and image formats. Save ready-made reports in the desired format and share them in any convenient way.Report design step-by-step
Our product provides a full cycle of working with reports - from connecting data to exporting a rendered document to variety of formats.


1
Connect data from various data sources by dragging them into the designer or adding them from the code.
2
Select the necessary components for displaying data - tables, charts, maps, text, barcodes, and more.
3
Customize the appearance of the report using a collection of styles, component editors. Add images and watermarks.


4
Present the data in the required form using grouping and sorting, variables, and mathematical formulas.
5
Go to preview to see the rendered report. Make the necessary changes, and prepare a report for printing or exporting.
6
Share the finished document on social networks or send it by email, export it to the required format, or publish it directly to the project.
1
Connect data from various data sources by dragging them into the designer or adding them from the code.
2
Select the necessary components for displaying data - tables, charts, maps, text, barcodes, and more.
3
Customize the appearance of the report using a collection of styles, component editors. Add images and watermarks.
4
Present the data in the required form using grouping and sorting, variables, and mathematical formulas.
5
Go to preview to see the rendered report. Make the necessary changes, and prepare a report for printing or exporting.
6
Share the finished document on social networks or send it by email, export it to the required format, or publish it directly to the project.
Excellent Web Platform Solution
The Stimulsoft reporting tool is an excellent solution for creating and viewing reports in any Web project.
- you are developing applications on modern platforms - ASP.NET, ASP.NET MVC, .NET Core, Blazor, and Angular;
- you want to get the desired result quickly, you should choose one of the many ready solutions and customize it to your requirements;
- you need close integration of reporting tools into the application, flexible settings of components, and visual design;
- you want to fully control user actions and all stages of creating, building, and exporting reports;
- your solution requires maximum functionality and high speed of rendering reports at a reasonable price.

AI functionality in the report designer
The report designer includes AI functionality to assist with various stages of report creation. The AI assistant is integrated into many elements, such as events, variables, conditions, and more. It can verify and correct connection strings for SQL data sources, check event script code, convert scripts written in Blockly to code, validate expressions, and much more.
Stimulsoft Ultimate
Stimulsoft Reports.WEB is part of Stimulsoft Ultimate, a comprehensive All-in-One set of products designed for working with data on all modern platforms such as .NET, ASP.NET, JavaScript, Java, PHP, Blazor, Angular, WPF, WinForms, Avalonia UI, Python, and others. With our components, you can create, print, export complex reports, analyze data using clear and colorful dashboards, and collect data from users through interactive forms.What's next?
We have prepared hundreds of reports and dashboards templates grouped by spheres of use. You can immediately use them by connecting your data or change according to your requirements. Our lessons and technical documentation will help make your work effective! Moreover, you can request the training courses from our technical specialists, subscribe to our YouTube channel to always get new videos, and receive all your answers in our online documentation.
Training courses
Are you faced with difficulties when creating reports and dashboards? This is not a problem!
Video lessons
We have prepared many video materials for the designing reports and dashboards. All tutorials are grouped by specific topics and regularly updated and supplemented.
Documentation
Our online user guides describe both the general functionality of the product and provide advice and suggestions for the report design and hints of setting components for reporting.